
Opinion:
Overseas: The European Central Bank's dovish interest rate hike, and the rebound in oil prices caused C PI and P PI to exceed expectations, pushing up U.S. inflation. (1) The U.S. non-seasonally adjusted CPI annual rate recorded 3.7% in August, a new high since May this year and the second consecutive rebound; the U.S. non-seasonally adjusted core CPI annual rate in August recorded 4.3%, a new low since September 2021. It has been declining for six consecutive months; the U.S. seasonally adjusted CPI monthly rate recorded 0.6% in August, a new high since June 2022, and the core CPI monthly rate increased 0.3% from July, the first accelerated increase in six months. After the core CPI data was released, market bets on the Federal Reserve to raise interest rates before November increased. ( 2 ) U.S. inflation expectations fell to the lowest level in more than two years in September as consumers became more optimistic about the economic outlook. Preliminary data from the University of Michigan shows consumers expect inflation to be 3.1% over the coming year, down from the 3.5% forecast in August and the lowest since early 2021. Respondents believed that the inflation rate in the next five to ten years would be 2.7%, the lowest since the end of 2020. Even so, the consumer confidence index fell to 67.7, lower than market expectations. (3) There are still differences within the European Central Bank. Gov. Muller: No further interest rate increases are expected in the coming months. However, if inflation rises again, further interest rate increases may still be needed; Vice President Guindos: CPI and core CPI index will continue to decline, and maintaining the current interest rate at this level for a period of time is sufficient to control inflation. Governing Council member Holzmann warned that he sees the risk that the European Central Bank may need to raise interest rates again, and that inflation risks have not weakened recently.
Domestic: Stable growth and further growth, real estate activity continues to recover. ( 1) On September 14, the central bank lowered the reserve requirement ratio for the second time this year since March this year, by 0.25 percentage points, and took effect the next day; this is the second time this year that the central bank has implemented a reserve requirement ratio cut to support the real economy. . (2) Many places have followed up on the relaxation of real estate demand-side policies: Cities such as Lanzhou, Fuzhou and Zhengzhou have completely canceled purchase restrictions, and cities such as Nanjing, Dongguan and Nantong have increased subsidies for home purchases. (3) Social finance data increased by 9% in August, with an increase of 3.12 trillion yuan in the month, and M2 increased by 10.6% year-on-year, indicating that the economic data exceeded expectations and indicated that the economy has stabilized. Data: (1) Economic fundamentals showed signs of marginal recovery in August: the year-on-year growth rate of industrial added value rose to 4.5% from 3.7% in July, the nominal year-on-year growth rate of social zero rebounded to 4.6%, and manufacturing investment demand increased. Improved, rising to 1.8% year-on-year in a single month. (2) In August, fiscal policy became looser year-on-year and social financing increased. The combined deficit of "general public budget + government funds" recorded 999 billion yuan, an increase of 224 billion yuan year-on-year. (3) New social financing increased by 3.12 trillion yuan in August, an increase of 631.6 billion yuan year-on-year. Among them, a net increase of 1.18 trillion yuan in government bonds in a single month, an increase of 871.4 billion yuan year-on-year, was the largest marginal contribution item. Funds: There is an overall net outflow of market funds, including a net outflow of northbound funds ; a net outflow of leveraged funds; an overall net outflow of industrial capital; a net inflow of trust newly issued securities investment trust scale; a net outflow of private equity private equity fund issuance scale. Valuation (1) Market valuation: The current valuation of FTSE China A 50 is at a relatively low level. As the domestic economy continues to recover, the RMB exchange rate stabilizes, and overseas interest rate hikes slow down, the attractiveness of the A-share market will increase.
In terms of A50, it rebounded on Monday last week, and then fell back in shock for four consecutive trading days, with trading volume declining. In terms of industries, most of Shenwan's first-level industries fell, and industry differences did not change much. Looking at industry weights, pharmaceuticals and biology are the main industries supporting the market. Food and beverages and non-bank finance drag down the FTSE China A 50, CSI 300 and Shanghai Stock Exchange 50. Power equipment, electronics, computers, etc. drag down the MSCI China A 50, Shanghai and Shenzhen Stock Exchange . 300, CSI 500 and CSI 1000. In terms of style, consumption and cyclical styles performed better, while financial and growth styles performed weaker. The blue chips of the broader market performed better than growth, with the FTSE China A 50 falling less than the MSCI China A 50. Domestically, a package of stabilizing growth policies related to improving real estate demand, local government debt, and activating the capital market have been introduced one after another. However, the market performance has been weak again after an early rebound, and the effects of domestic policies are not yet obvious. Overseas, the U.S. economy is still resilient, U.S. bond yields are rising, the U.S. dollar is strengthening, capital is flowing out, and external depreciation pressure on the RMB remains, suppressing A-shares. However, domestic policies are expected to continue to increase, and valuations, sentiments and investor behavior further show bottom characteristics. The opportunities at the current position outweigh the risks, and it is recommended to go long on dips.
Figure 1 Overview of the stock index’s rise and fall since the beginning of the year
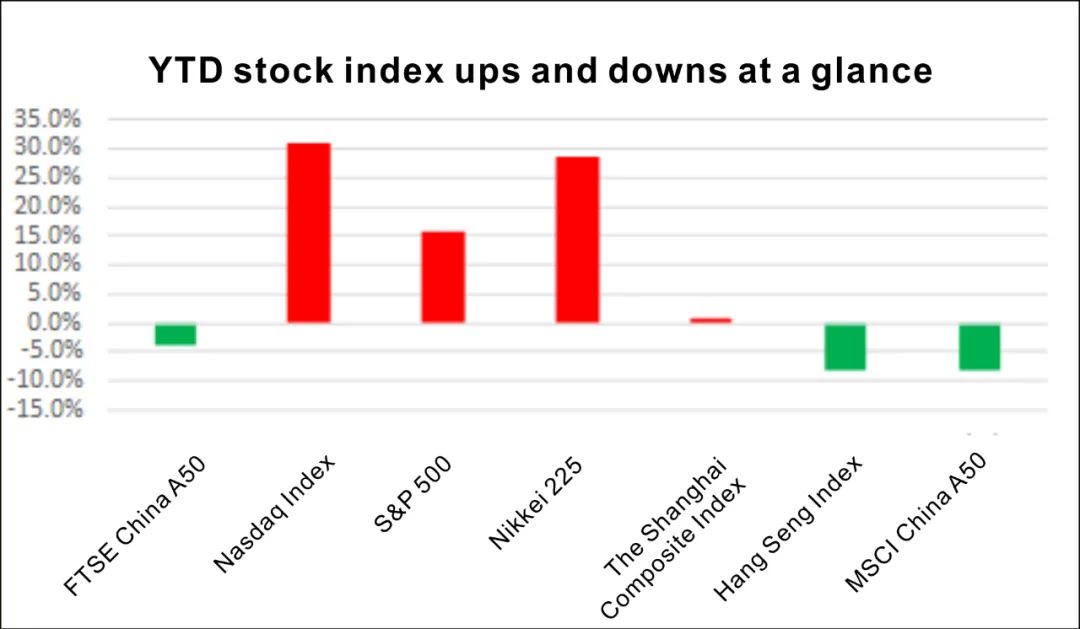
Data sources: HGNH, wind
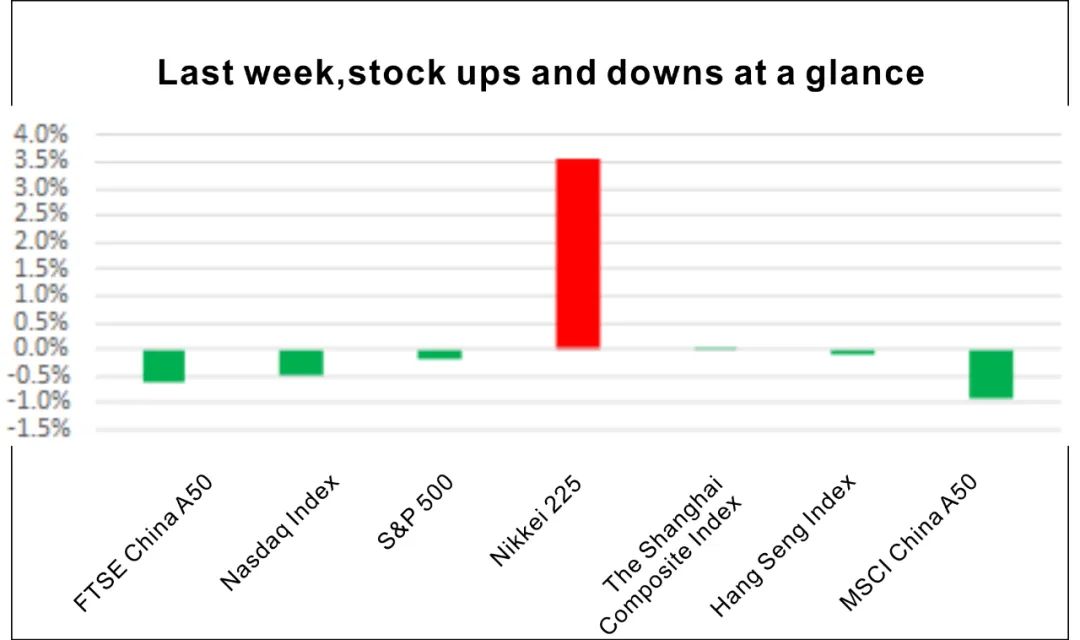
Figure 2 List of increases and decreases last week
I.Technical Analysis
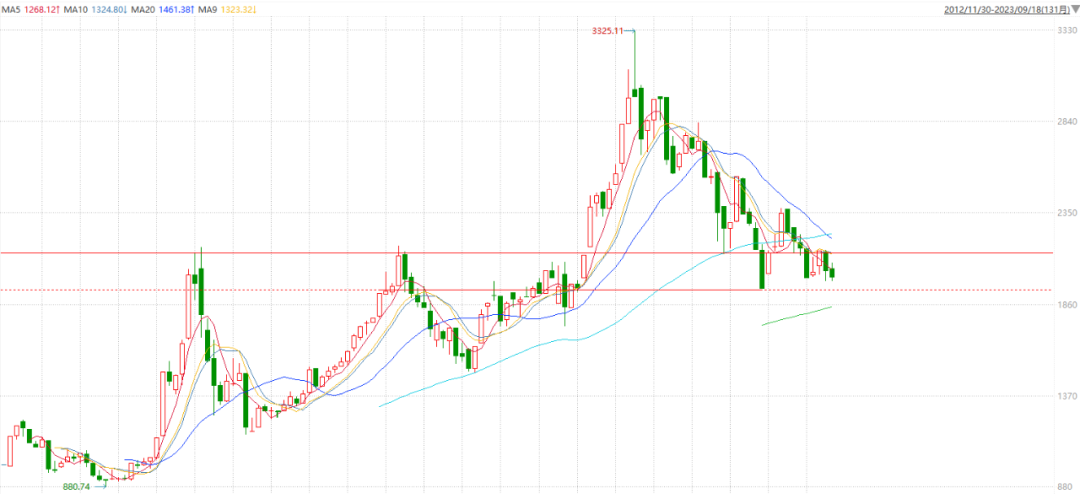
From the technical analysis point of view, FTSE China A50 and MSCI China A50 are oscillating within the range. Pay attention to the long and short performance of this position.
Figure 3 FTSE China A50 trend
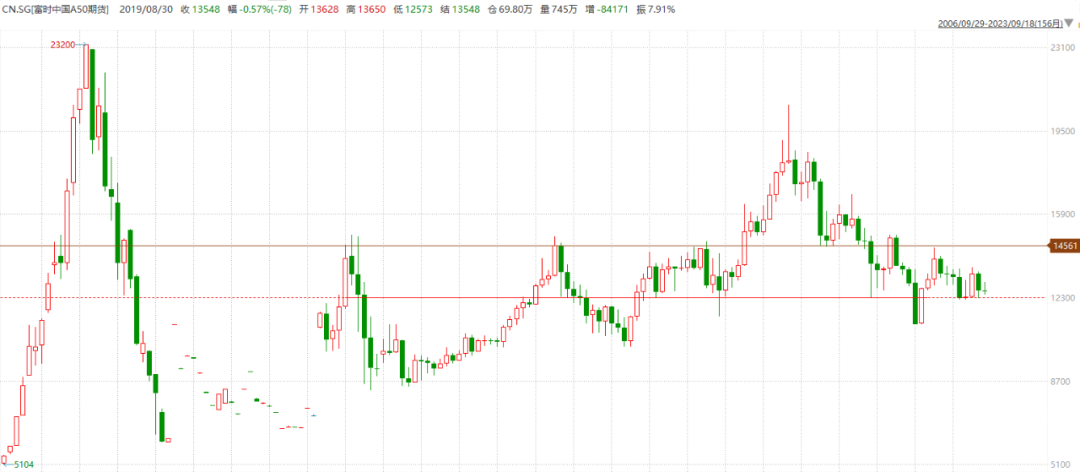
Figure 4 MSCI China A50 trend
II.Funding
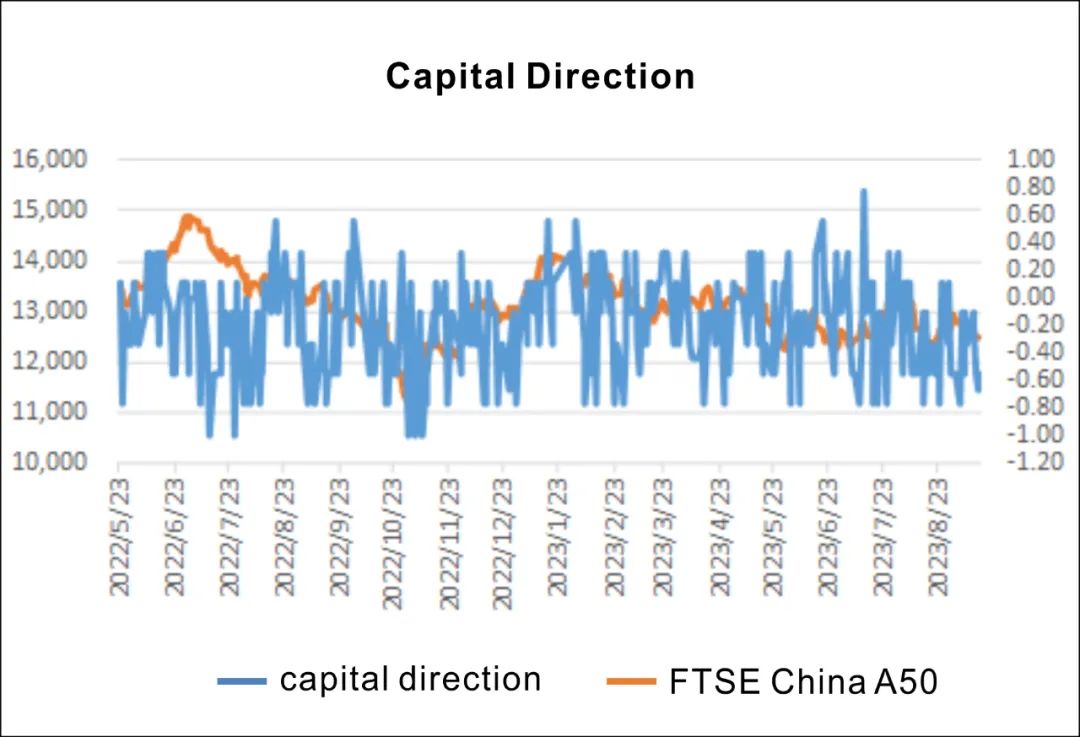
Divided into major categories such as industrial capital, overseas institutional investors (northbound funds), domestic institutional investors (public funds, trusts, private equity, brokerage asset management, insurance), domestic individual investors, and leveraged funds. According to the test of capital indicators by Huatai Securities Metalworking , it was found that the following 9 indicators have the highest correlation with the trend of A-shares. Therefore, 9 indicators are used to construct a multi-indicator timing strategy: the original signals of the indicators are summed [ -1,1]. When the signal < -0.5, a short position is opened, and when the signal > =0, the position is closed. When the signal > 0.5, open a long position; when the signal < =0, close the position. The current capital signal is -0.11, and there is no opening signal.
Last week, there was an overall net outflow of market funds: including a net outflow of northbound funds ; a net outflow of leveraged funds, a net outflow of margin financing and securities lending balances, and a net outflow of margin trading and securities lending transactions; an overall net outflow of industrial capital, a total increase in senior executives’ holdings, a net outflow of senior executives’ Net outflows from holding /reducing holdings, net outflows from stock repurchase implementation amounts; net inflows from trust newly issued securities investment trusts; net outflows from private equity private equity fund issuances.
Table 1 Capital signals
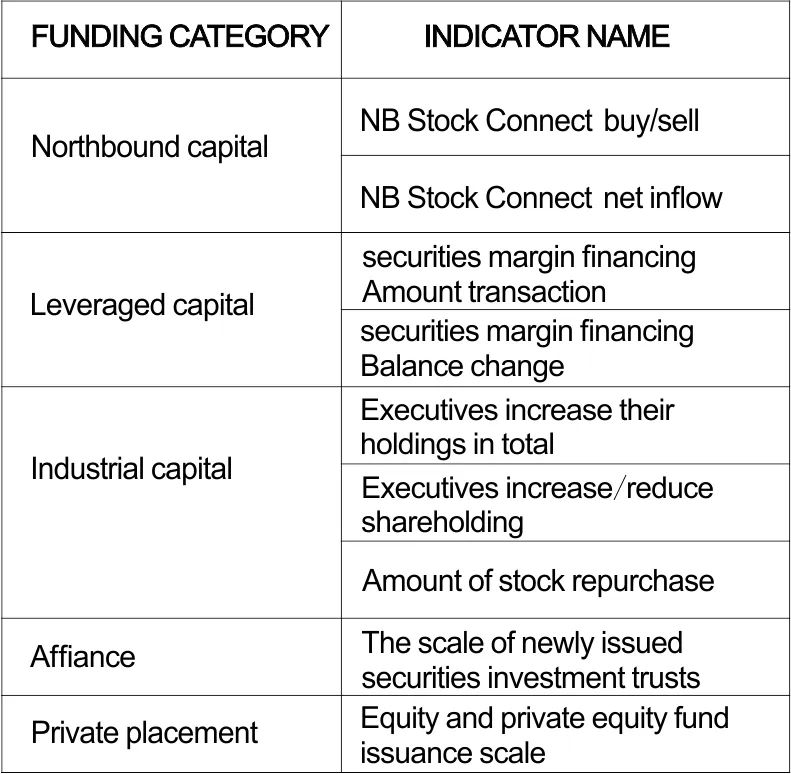
Figure 5 Capital and A50 trends
III. Index valuation
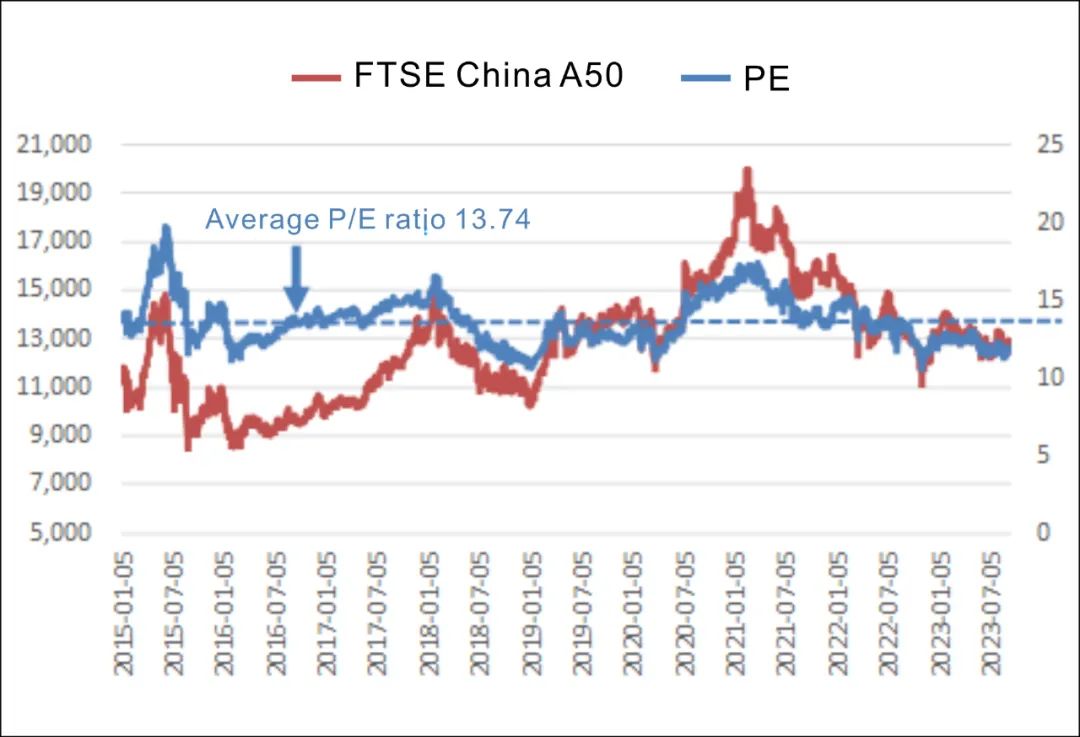
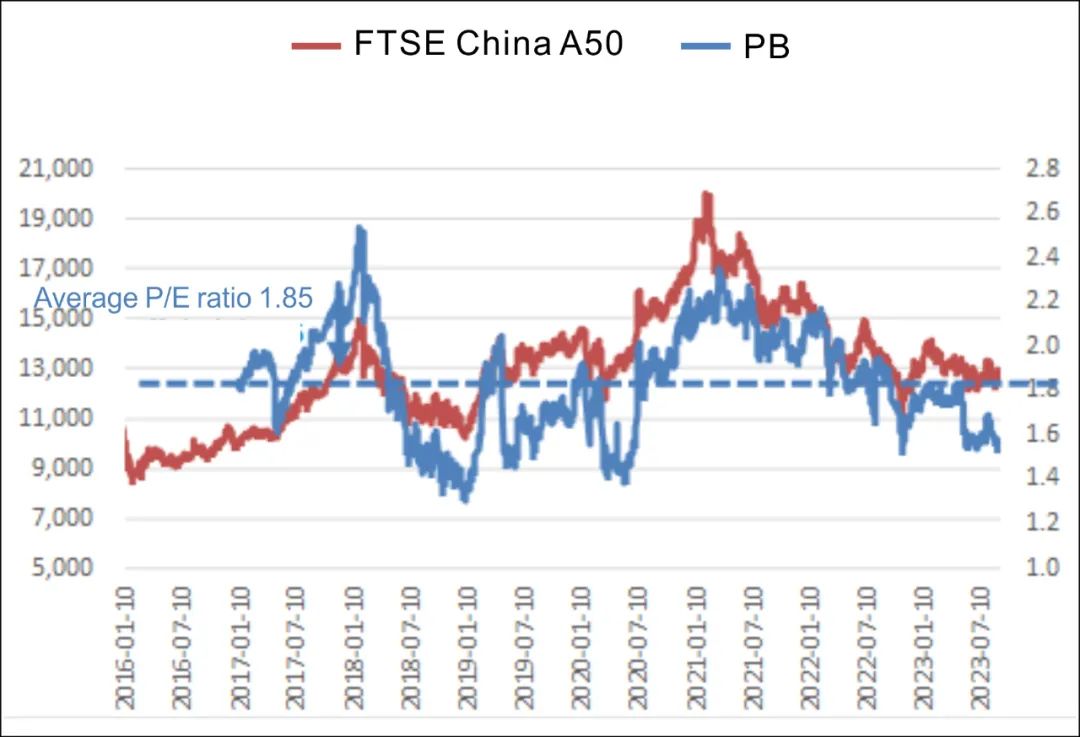
Currently, PE is at the 8 % percentile since 2015 , and P B is at the 20% percentile since 2015, with a low valuation.
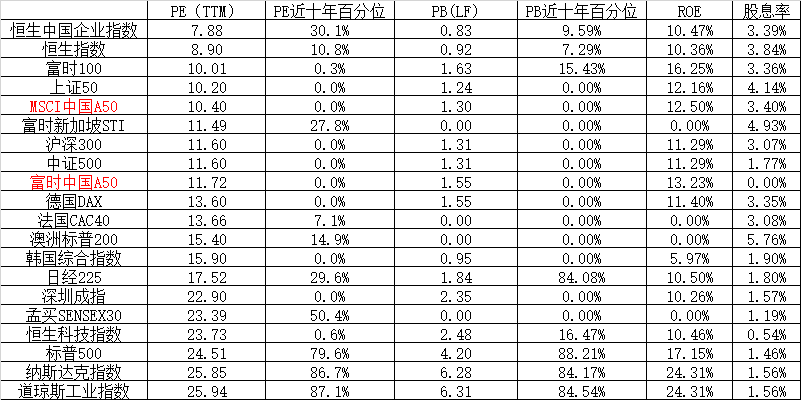
Compared with other global indexes, as China's economy continues to recover and the Fed's interest rate hikes cool down, the A-share index has become more attractive to overseas funds.
Calculation formula : price-to-earnings ratio PE (TTM) = 1/SUM (Wi/PEi), price-to-book ratio PB (TTM) = 1/SUM (Wi/PBi) , return on net assets ROE = PB/PE.
Figure 6 Valuation analysis of each index
IV. Spread Analysis
Intertemporal arbitrage: The upper and lower rail range of the Bollinger Bands for the FTSE China A 50-month spread: [ -47, 10], the upper and lower rail range of the Bollinger Bands for the M SCI China A 50-month spread: [ -20, 13], It is recommended that arbitrage can be carried out if the spread exceeds this range.
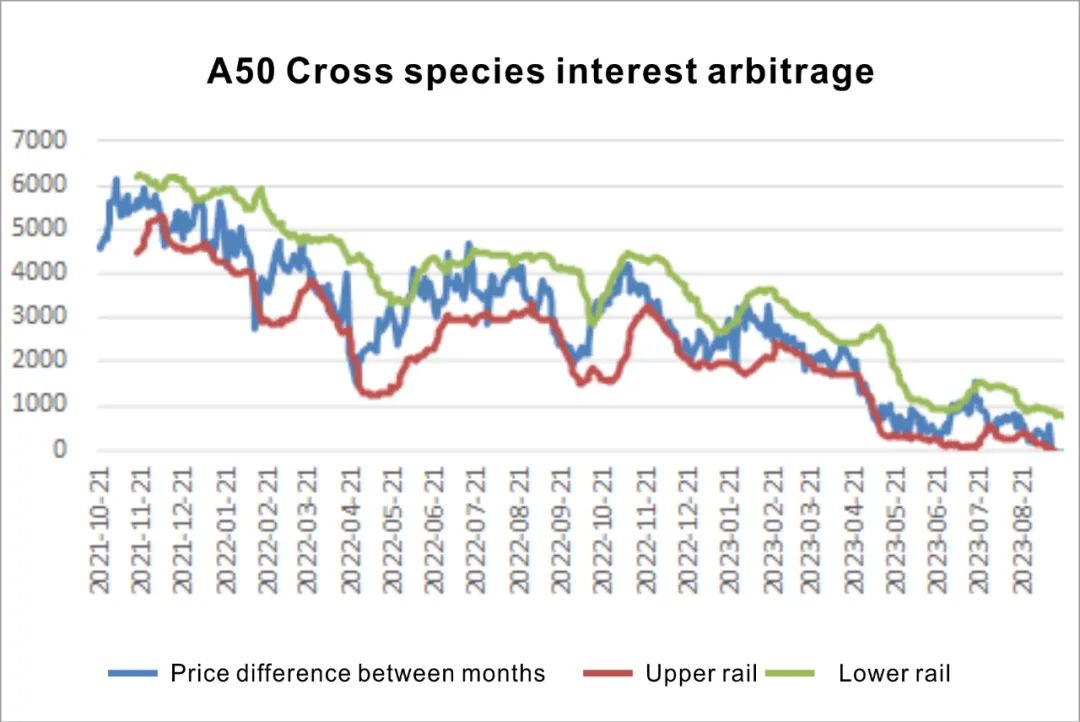
Cross-variety arbitrage: S GXA50- M SCI China A 50 cross-variety price difference upper and lower Bollinger Band range: [ -266,770], the current cross-variety market is in a unilateral market, it is recommended to wait and see.
Figure 7 Application of Bollinger Tracks in FTSE China A 50- month spread
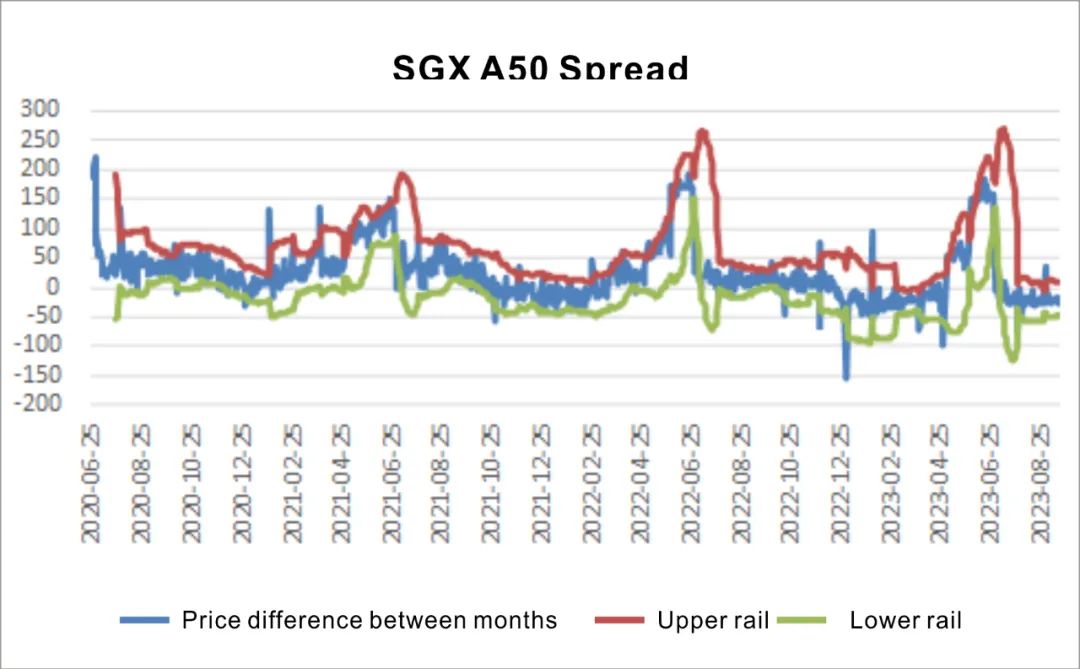
Figure 8 Application of Bollinger Tracks in MSCI China A 50- month spread
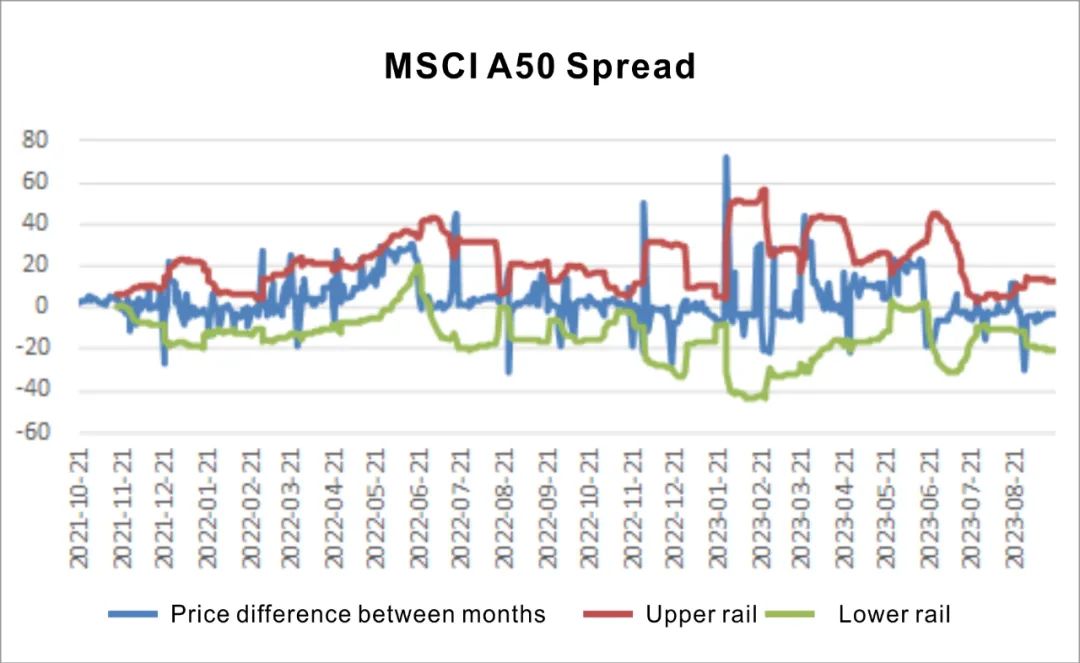
Figure 9 Application of Bollinger Tracks in S GXA50- M SCI China A 50 cross-variety spread
V. Risks
(1) Domestic economic recovery is slower than expected; (2) Sino-US trade friction intensifies; ( 3 ) Domestic and overseas liquidity tightens more than expected; ( 4 ) Geopolitical turmoil further escalates.