Opinion:
Overseas: Exceeded expectations of PMI data led to an upward movement of Fed rate hike expectations. (1) The US and Europe's April composite PMI exceeded expectations and the services PMI continued to improve. The US April PMI exceeded expectations, recording 53.5 (53.3 in March), exceeding Bloomberg's consensus estimate of 51.2. Among them, the service sector PMI was 53.7, maintaining a high boom and higher than Bloomberg's consensus estimate of 51.5; the manufacturing PMI was 50.4, back above the PMI reading, and the manufacturing PMI purchase price and ex-factory price sub-items were higher than in March. upward, at 59.4 and 58.0 respectively, suggesting that core commodity inflation may be recurring. (2) The Fed's total assets continued to fall, but both the Fed's BTFP and discount window loan stocks to financial institutions returned to an uptrend. (3) Global and US travel activity continued to heat up. The number of global and business flights continued to pick up last week, increasing by 1.9% and 3.2% year-on-year respectively. Travel activity in the US picked up in tandem, with TSA security screening numbers increasing by 2% year-on-year and New York underground passenger traffic increasing by a significant 7% year-on-year. US hotel occupancy also picked up by 2.9 percentage points to 64.2%, above the same level in 2022. (4) On the 21st it was reported that the US would restrict US companies from investing in China, focusing on sectors such as AI, chips and quantum computing. On the news, recent hot sectors such as TMT sank, which in turn contributed to the overall market decline.
Domestic: (1) Macro data: GDP and social zero growth in the first quarter both rebounded beyond expectations: real GDP grew by 4.5% and nominal GDP grew by 5%, with exports strong and resilient with the largest expected difference; social zero rebounded to 10.6% in March, mainly boosted by the strong recovery in optional consumption. (2) Economic activity: resident travel activity remained high last week, logistics indicators continued to pick up, auto sales rebounded sharply and industrial production slowed; both new and second-hand house transactions fell sequentially, while land transactions moved higher sequentially. (3) Market valuation: The current FTSE China A50 valuation is at a relatively low level. With the cooling of expectations of interest rate hikes by the Federal Reserve and the continued repair of the domestic economy, the attractiveness of the A-share market will increase.
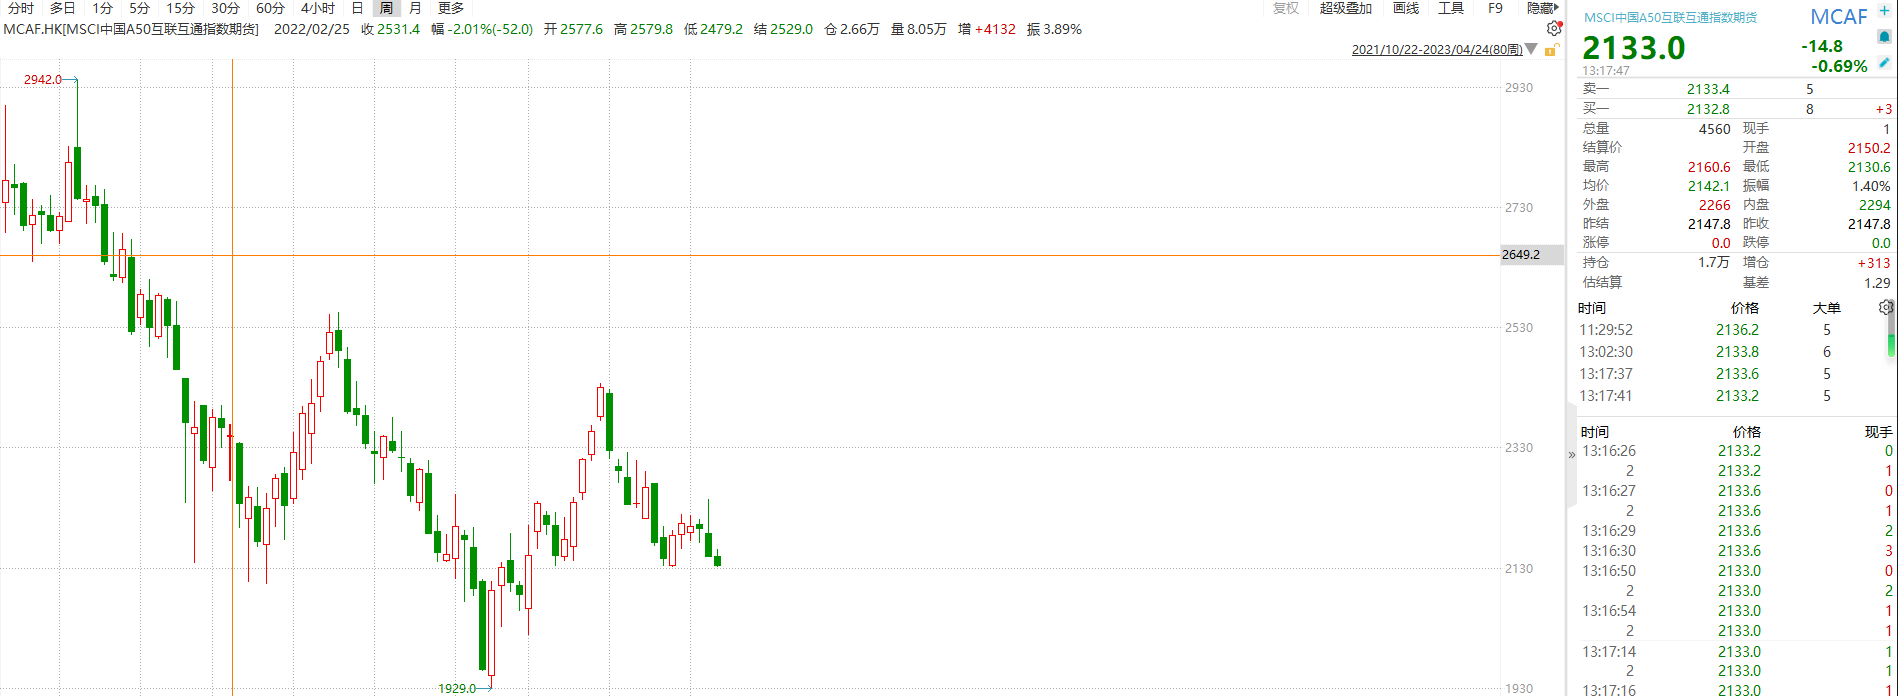
On the A50, the A50 was dominated by pullbacks last week, with large gains in the first two trading days followed by three consecutive days of sharp declines. In terms of sectors, the vast majority of the Shewan Tier 1 sectors retreated during the week, with sectoral differences falling slightly. Combined with the sector weights, banks and non-bank financials supported the FTSE China A50, MSCI China A50, CSI 300 and SSE 50 respectively, while power equipment, pharmaceuticals and biology, and electronics were the main drags on the CSI 500 and CSI 1000. In terms of various influencing factors, the overseas banking crisis has gradually eased, but the market is concerned about future tight credit risks. In addition, last week, the Biden administration said it would issue an executive order next month to restrict US companies' investment in China in key areas such as chips, artificial intelligence, and quantum investments, leading to a recent dip in hot sectors such as TMT, which in turn contributed to the overall market decline. On the domestic front, economic data continued to repair in March, but there were structural concerns. Although the economic growth rate in the first quarter exceeded expectations, the growth rates of various sub-sectors of investment have declined, while the newly released EPMI index for April also fell back. In the short term, the market is affected by the friction between China and the United States, the sentiment is pessimistic, the plate is still likely to continue to fall. However, in the medium to long term, with the continued validation of the domestic economic recovery, overseas risk aversion has fallen, the market may rebound from the bottom. The short-term market is expected to be dominated by shocks, and it is recommended to wait and see.
Fig. 1 A list of stock index ups and downs since the beginning of the year
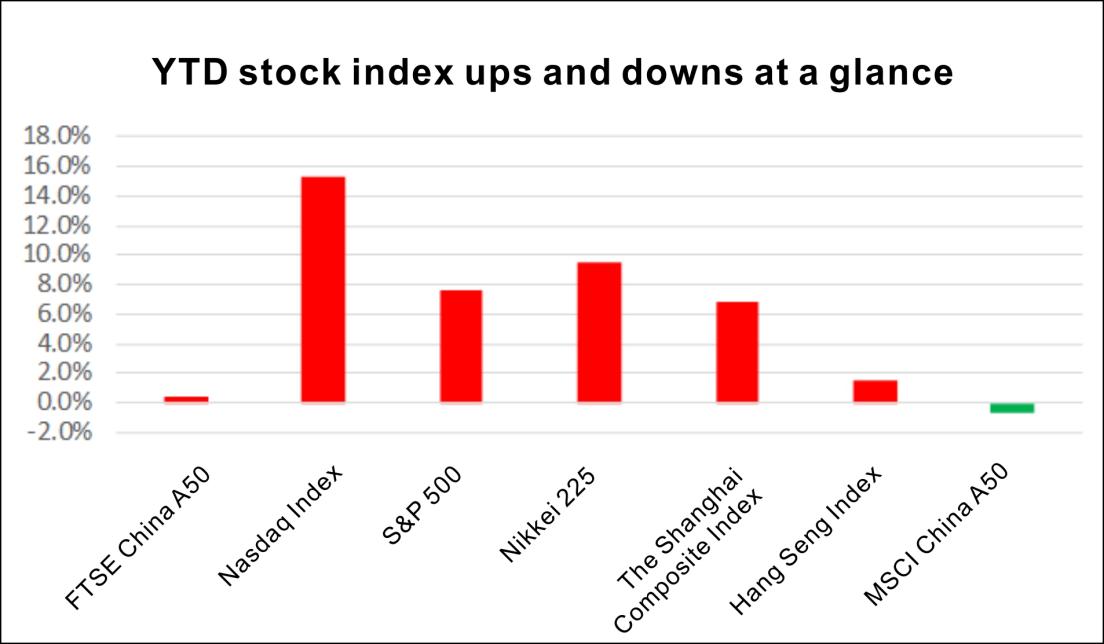
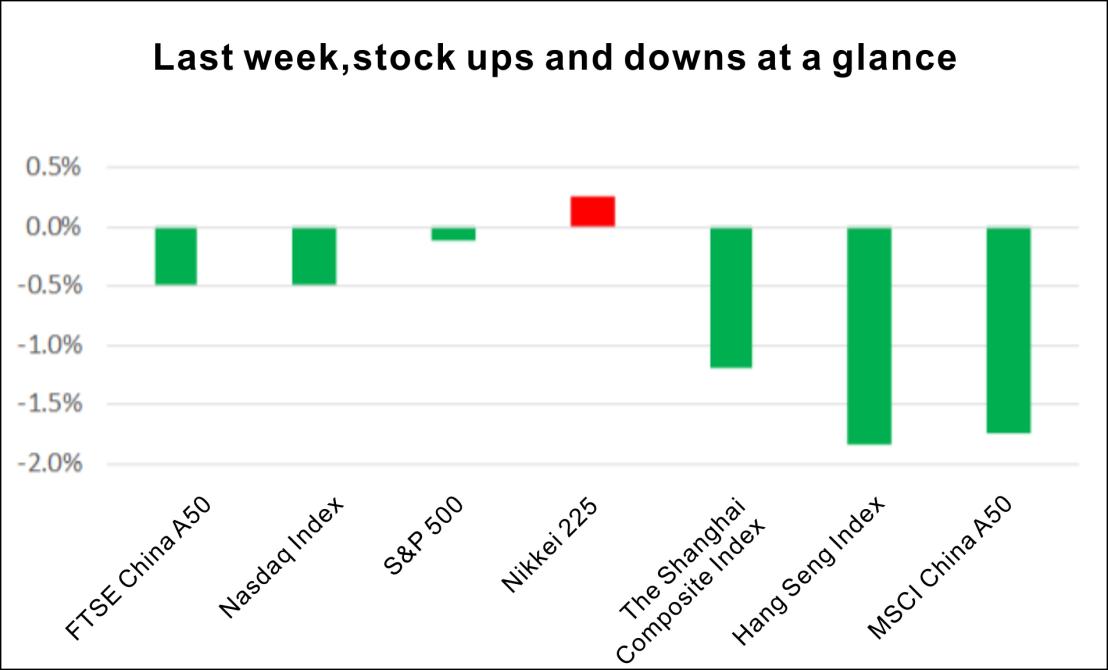
Fig. 2 Ups and downs last week
I.Technical analysis
From a technical analysis, the FTSE China A50 and MSCI China A50 daily rebounded from the bottom and broke upwards, keeping an eye on the breakout of pressure levels.
Figure 3 Trend of FTSE China A50
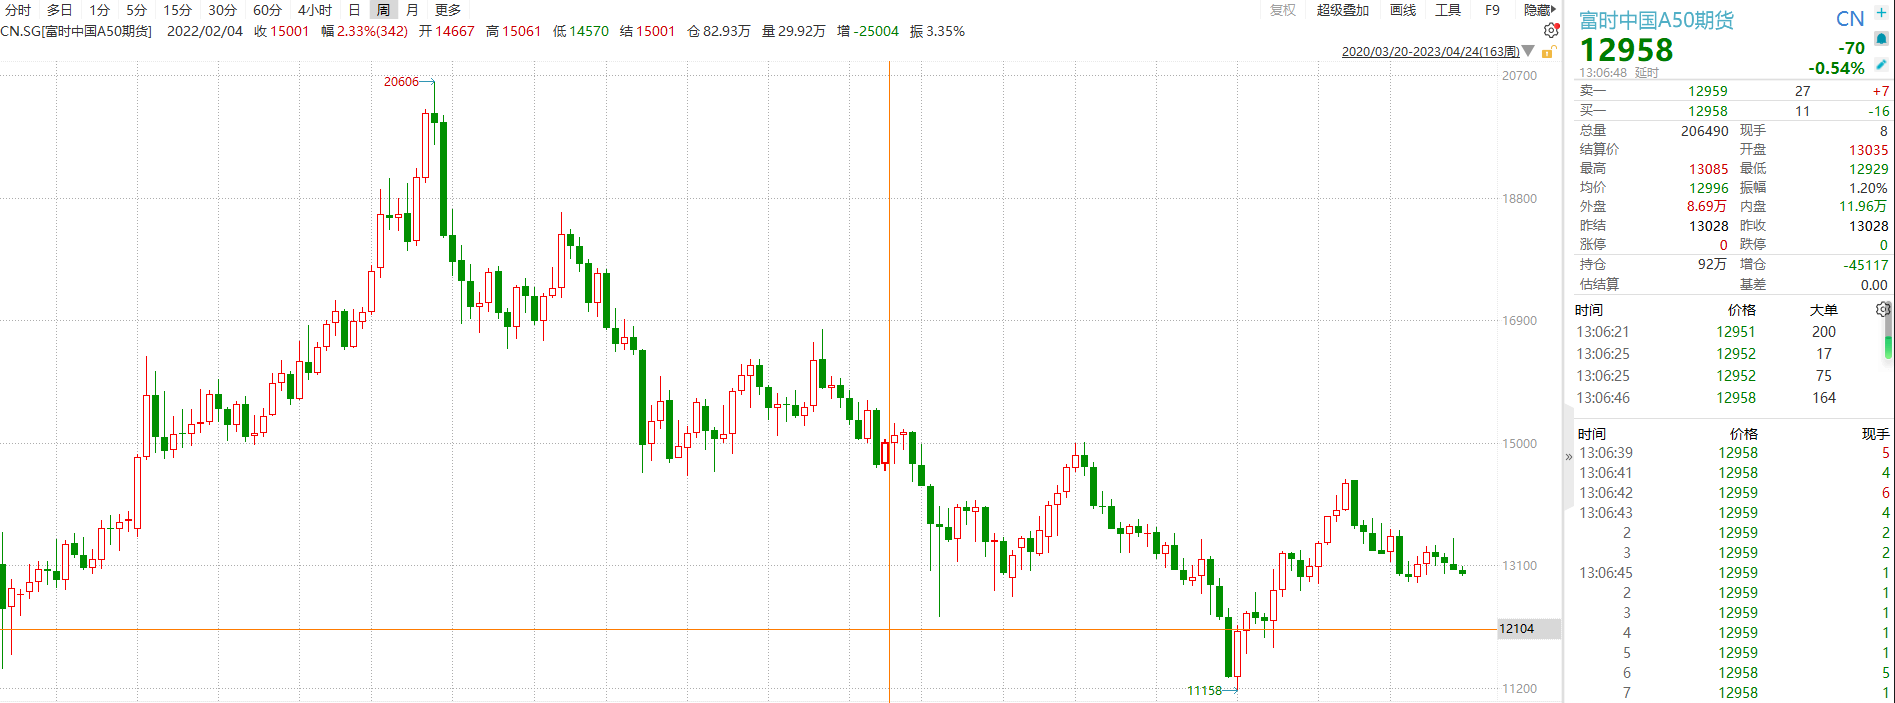
Figure 4 Trend of MSCI China A50
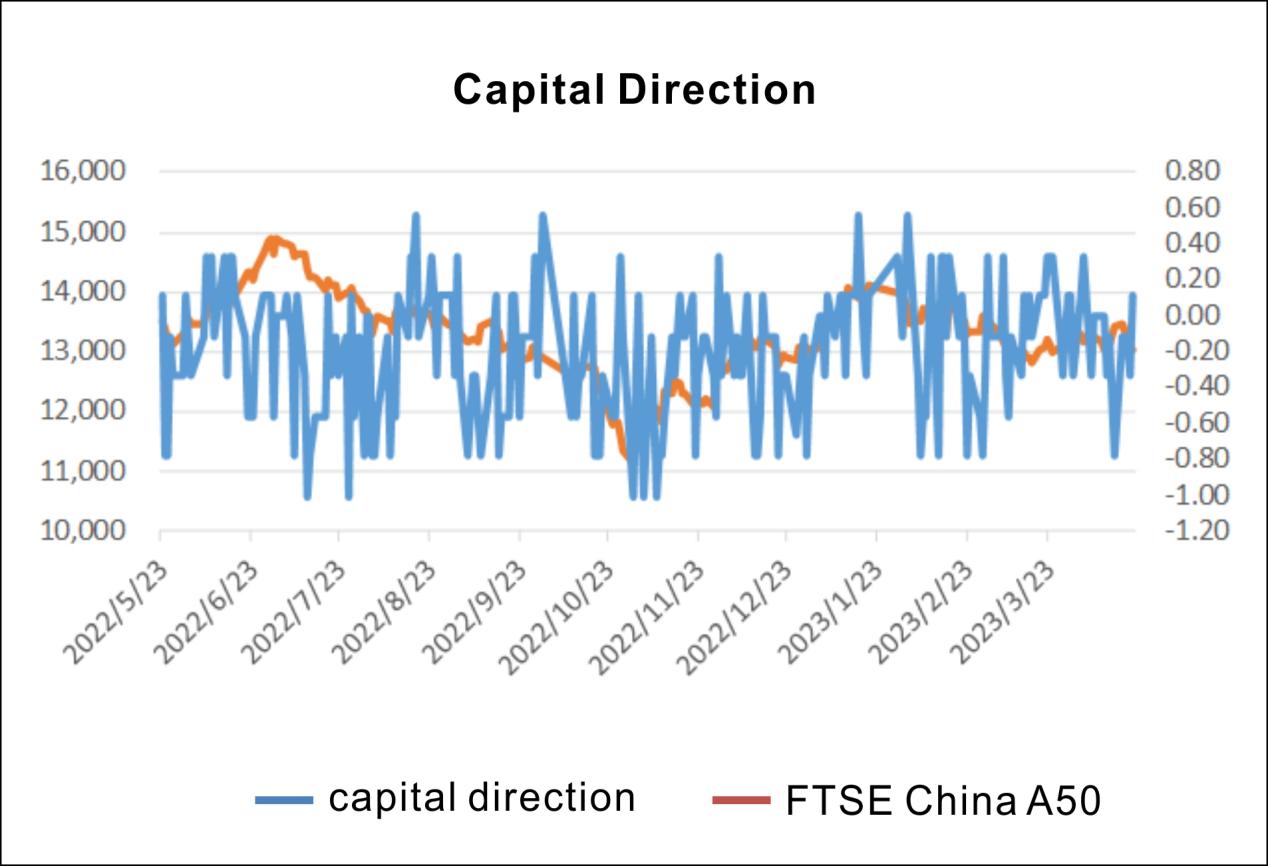
II.Capital side
The funds in the A-share market are divided into broad categories such as industrial capital, overseas institutional investors (northbound funds), domestic institutional investors (public funds, trusts, private equity, brokerage capital management and insurance), domestic individual investors and leveraged funds. According to Huatai Securities Goldwork's testing of capital indicators, the following 9 indicators have the highest correlation with A-share movements. Therefore, the 9 indicators will be constructed into a multi-indicator timing strategy: the original signals of the but indicators will be summed [-1,1], when the signal <-0.5, short positions will be opened, and when the signal >= 0, positions will be closed. When the signal > 0.5, open a long position, when the signal <= 0, close the position. Current money signal = -0.11, no open position signal.
Last week, the overall net outflow of market funds: including net outflow of northbound funds; net outflow of leveraged funds, net outflow of financing and financing balances, net outflow of transaction amounts; overall net outflow of industrial capital, net outflow of total executive holdings, net outflow of executive holdings/reductions, net outflow of stock repurchase implementation amounts; net outflow of trust new issue securities investment trust scale; net inflow of private equity-based private equity fund issue scale.
Figure 5 Capital side and A50 trend
III. Index valuation
The FTSE China A50 is currently trading at 12.68x PE, at the 4% quartile over the last seven years, and 1.77x PB, at the 20% quartile over seven years. The MSCI China A50 is trading at 10.39x PE, at the 36% quartile, and 1.41x PB, at the 64% quartile.
Compared to the SSE 50, CSI 300, the A50 has a larger ROE on NAV, with the FTSE China A50 at 14 and the MSCI China A50 at 13.6.
Compared to other global indices, the A-share index has become more attractive to overseas funds as China's economy continues to recover and the Fed's interest rate hike cools.
Calculation formula: P/E PE(TTM) = 1/SUM(Wi/PEi), P/N ratio PB(TTM) = 1/SUM(Wi/PBi), ROE = PB/PE.
IV. Analysis of price difference
Cross-period arbitrage: The upper and lower Bollinger Bands of the FTSE China A50 inter-month spread range: [-54, 21], the upper and lower Bollinger Bands of the MSCI China A50 inter-month spread range: [-15, 35], it is recommended that spreads break out of this range for arbitrage.
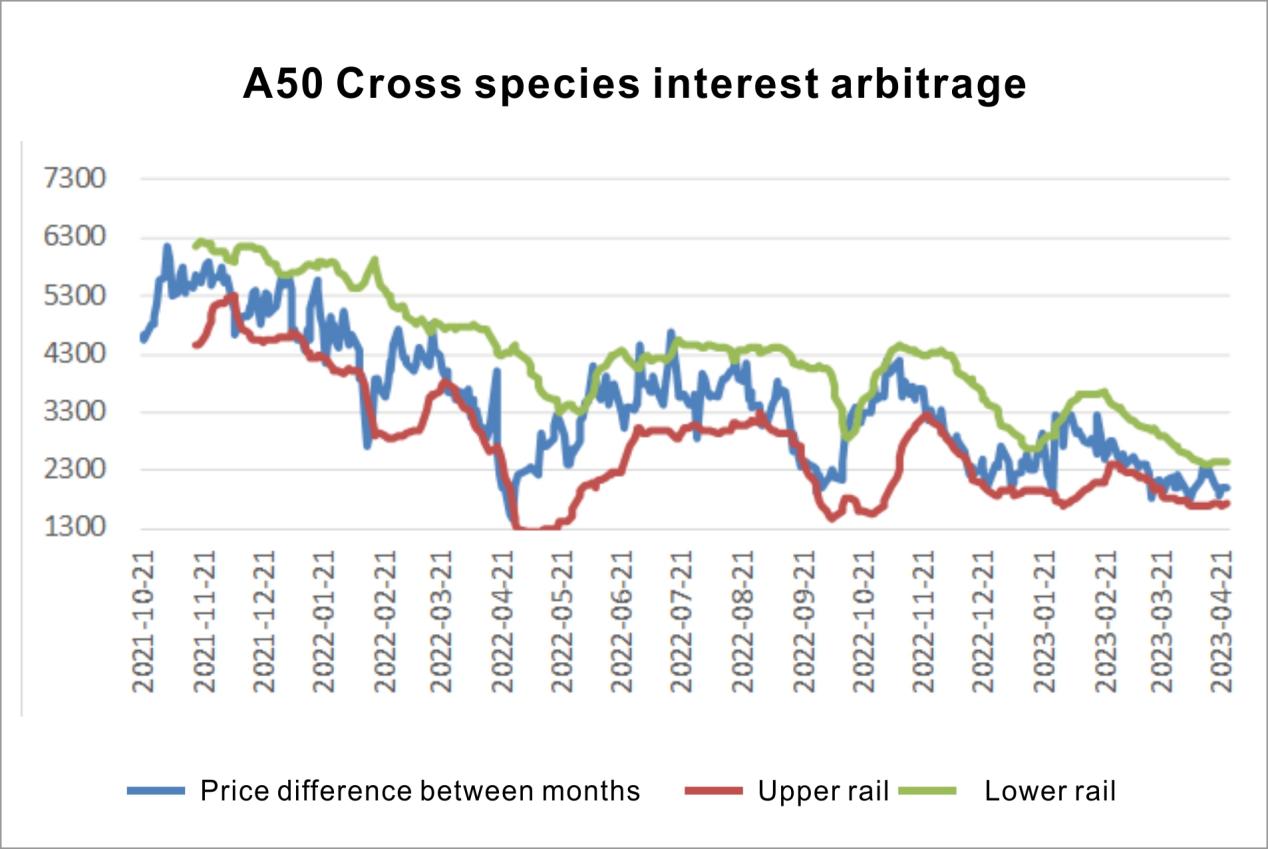
Cross-species arbitrage: SGXA50-MSCI China A50 cross-species spreads have an upper and lower Bollinger Bands range of [1713, 2437], it is recommended that spreads break out of this range for arbitrage.
Fig. 6 Application of Bollinger orbit in FTSE China A50-month price difference
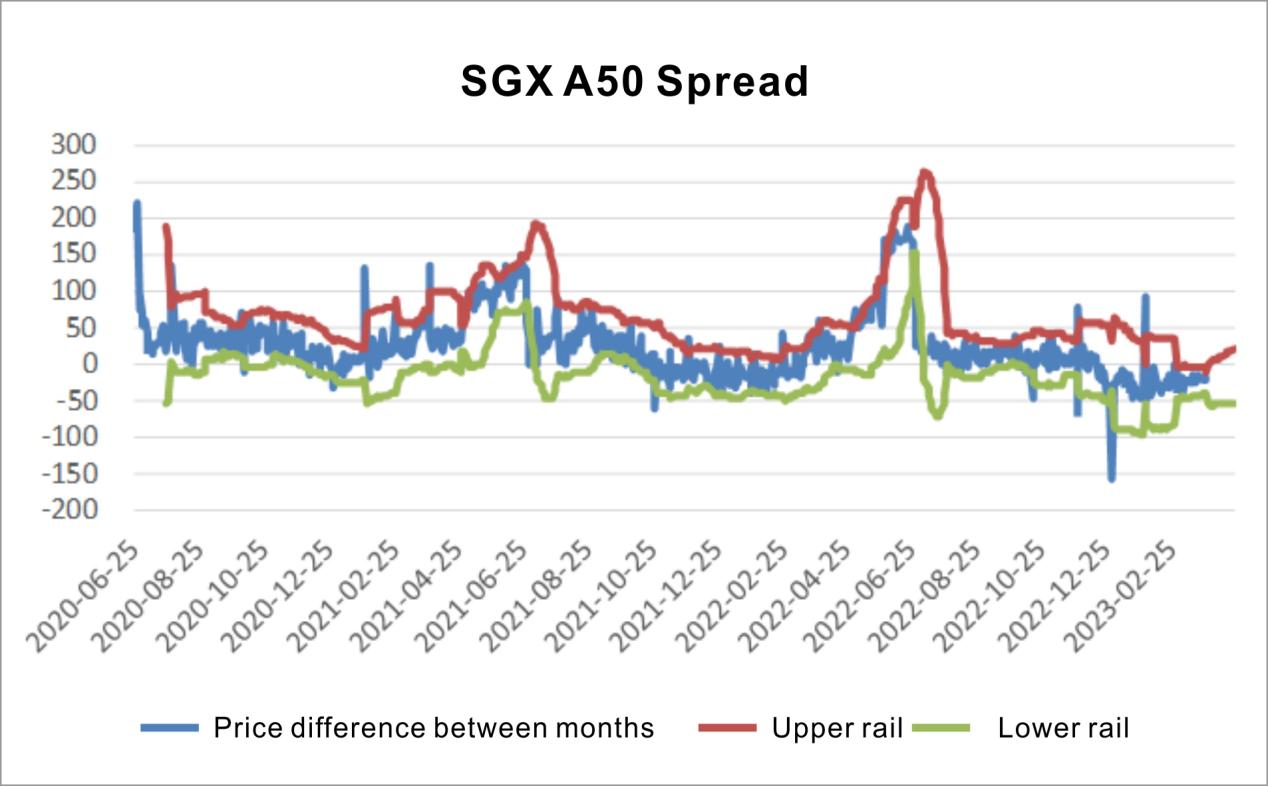
Fig. 7 Application of Bollinger orbit in MSCI China A50-month price difference
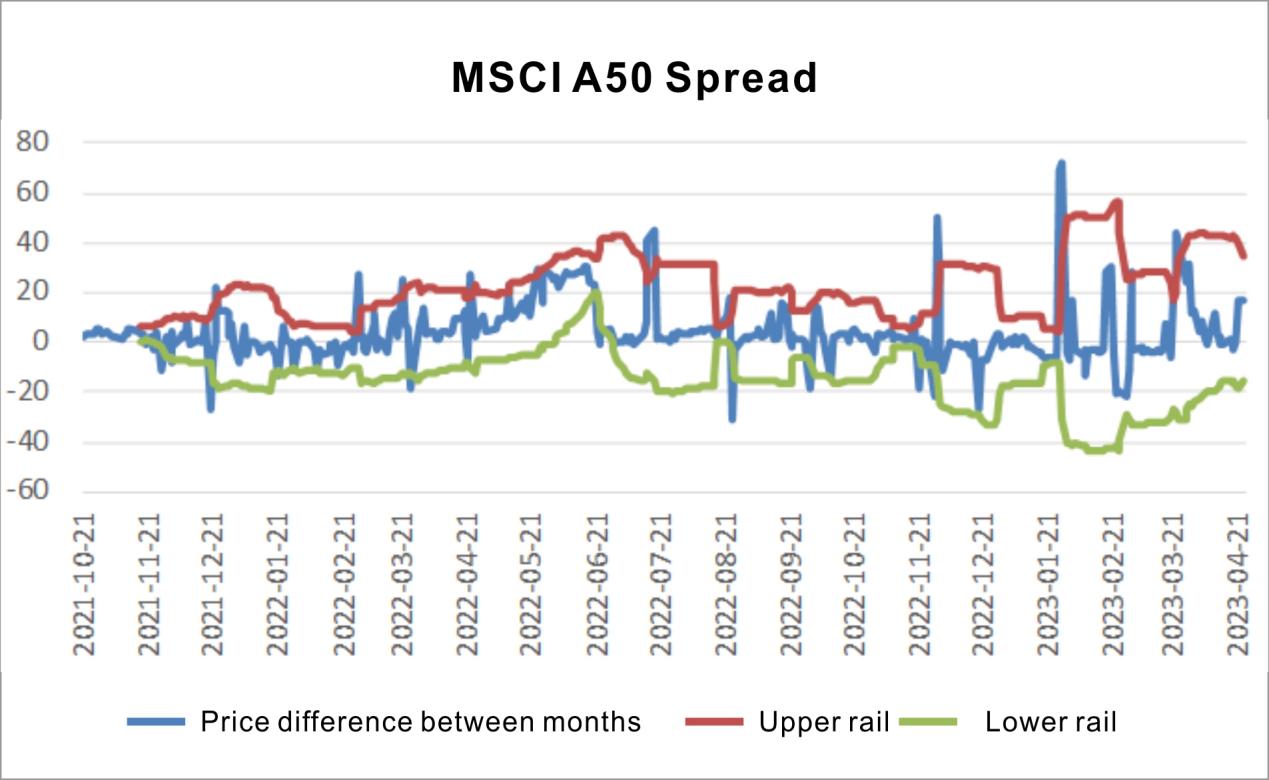
Fig. 8 Application of Bollinger orbit in SGXA50-MSCI China A50 Cross-Variety Pricedifference